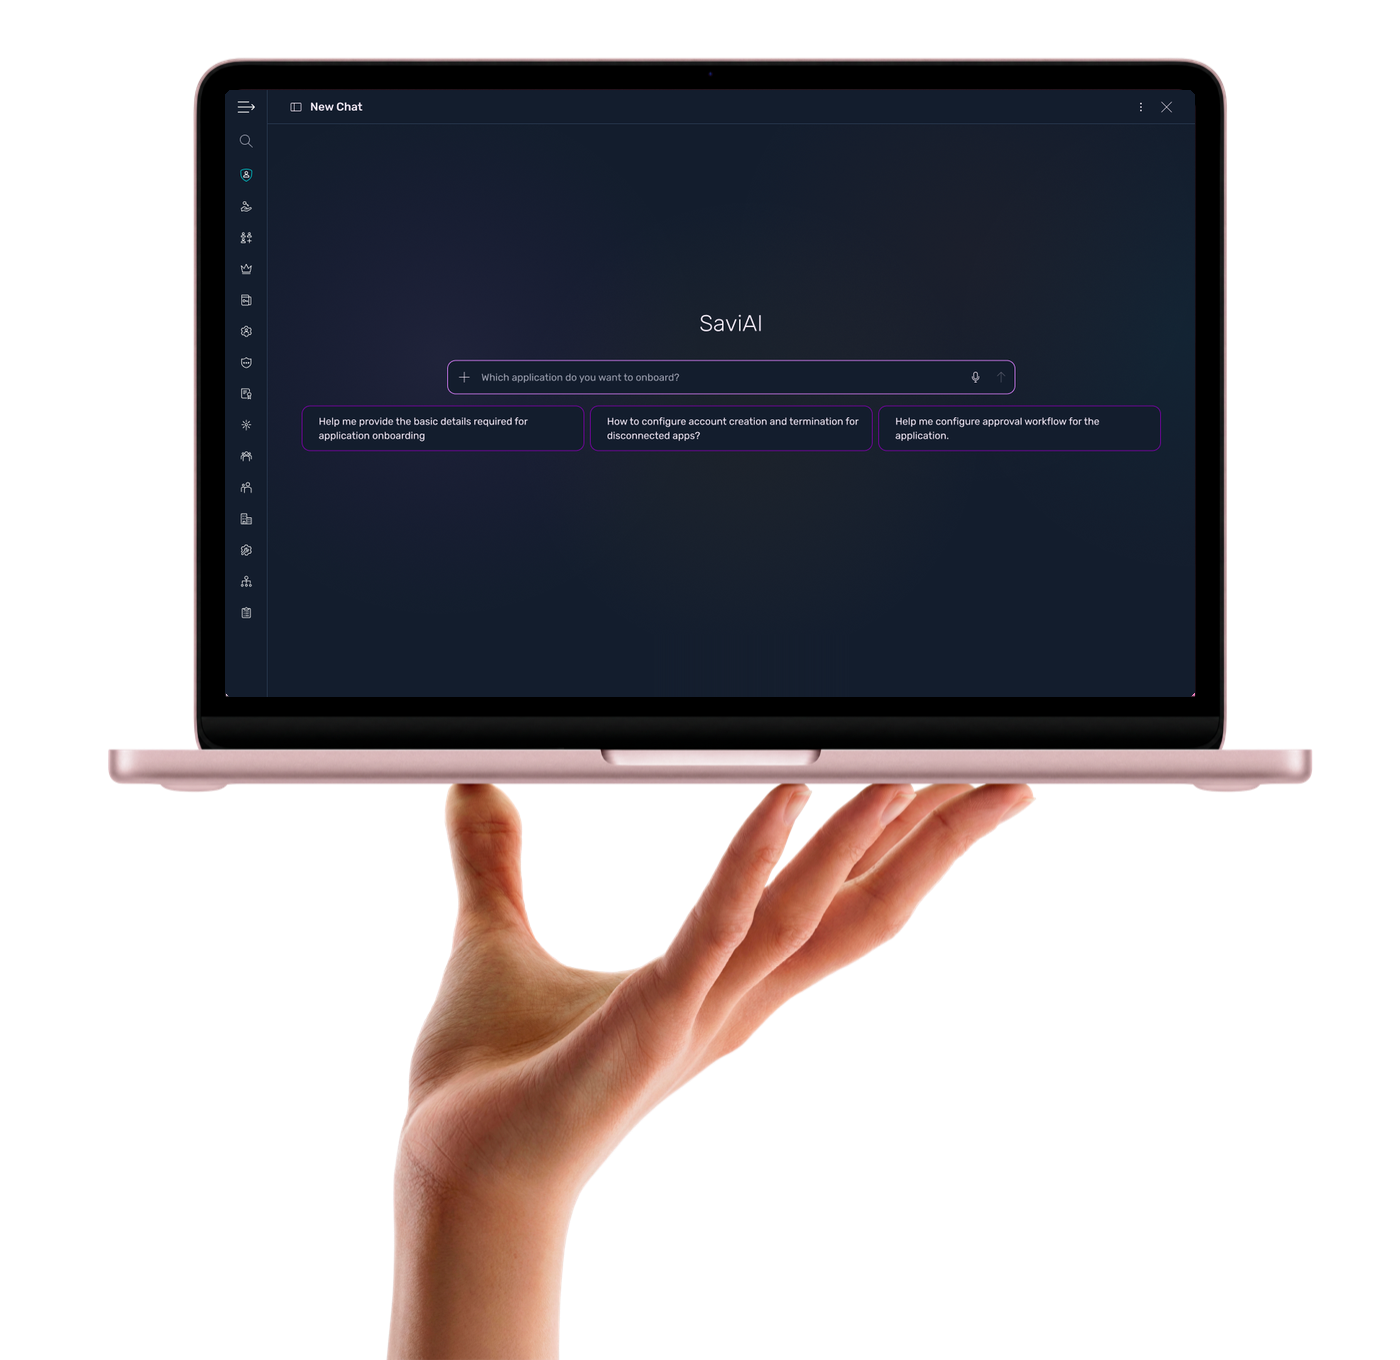
Endpoint Insight PA Agent
An intelligent investigation workspace that helps IT admins detect endpoint issues 22% faster, resolve more of them on the first attempt, and reach the root cause in 26% fewer steps.
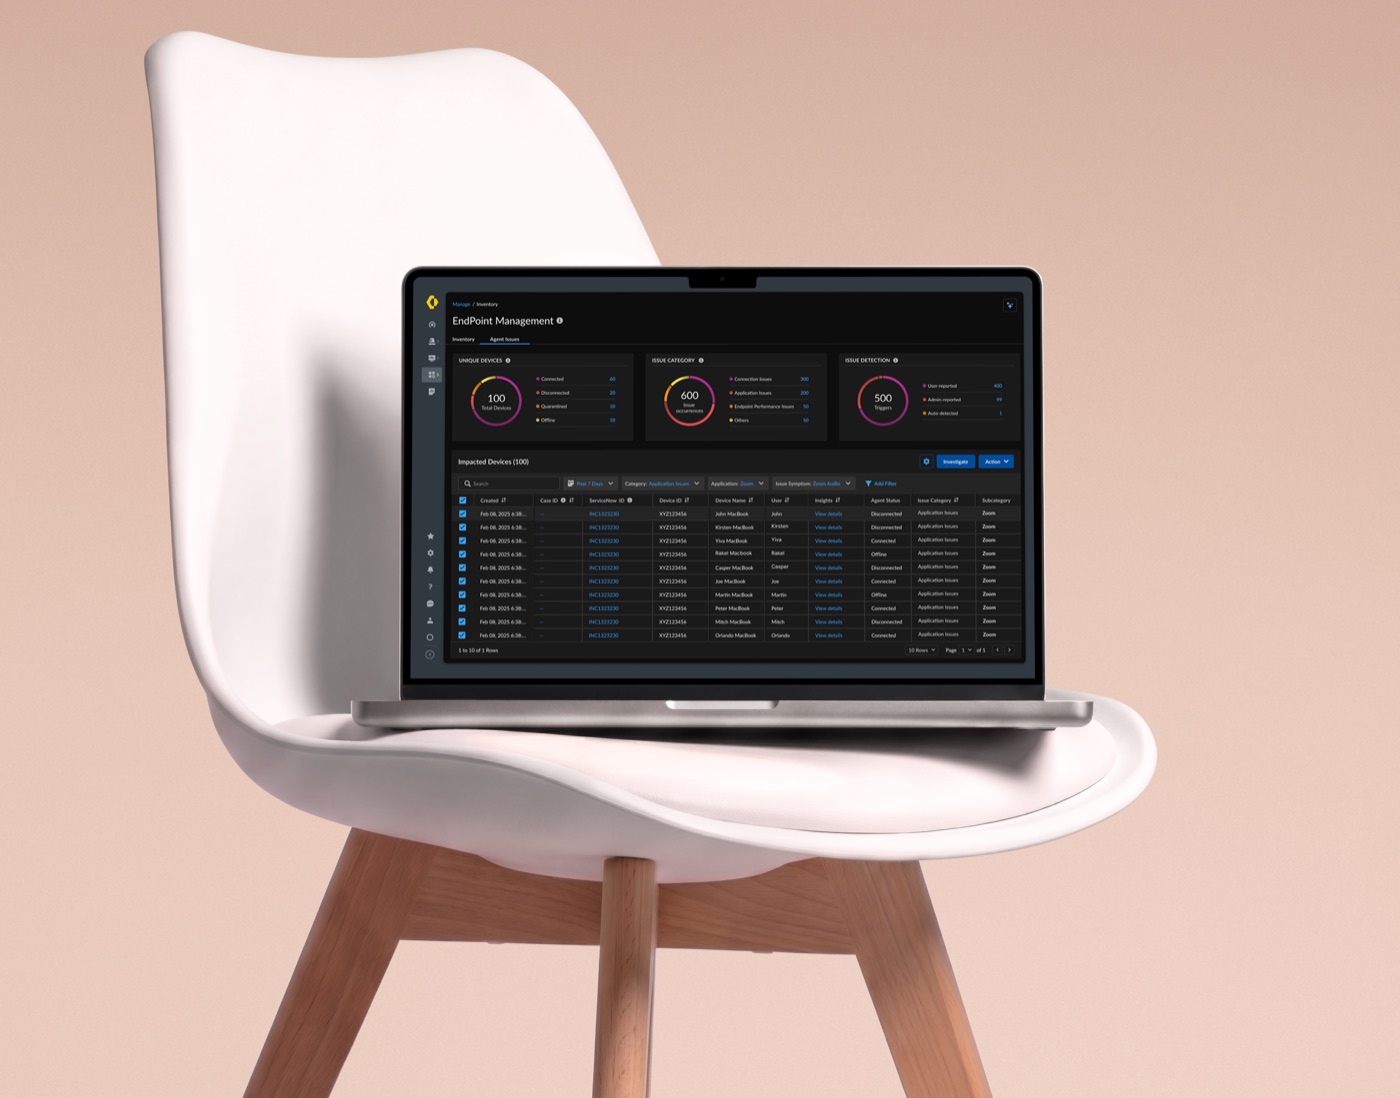
Support teams were flying blind.
When information about endpoint health, user activity, system behaviour and historical issues is fragmented, support teams are forced to react after problems have already hit users.
Teams spent valuable time investigating issues that had already been solved, relied on repeated escalations, and performed redundant troubleshooting, even when a known solution already existed.
Reactive, slow and expensive.
 An uphill investigation
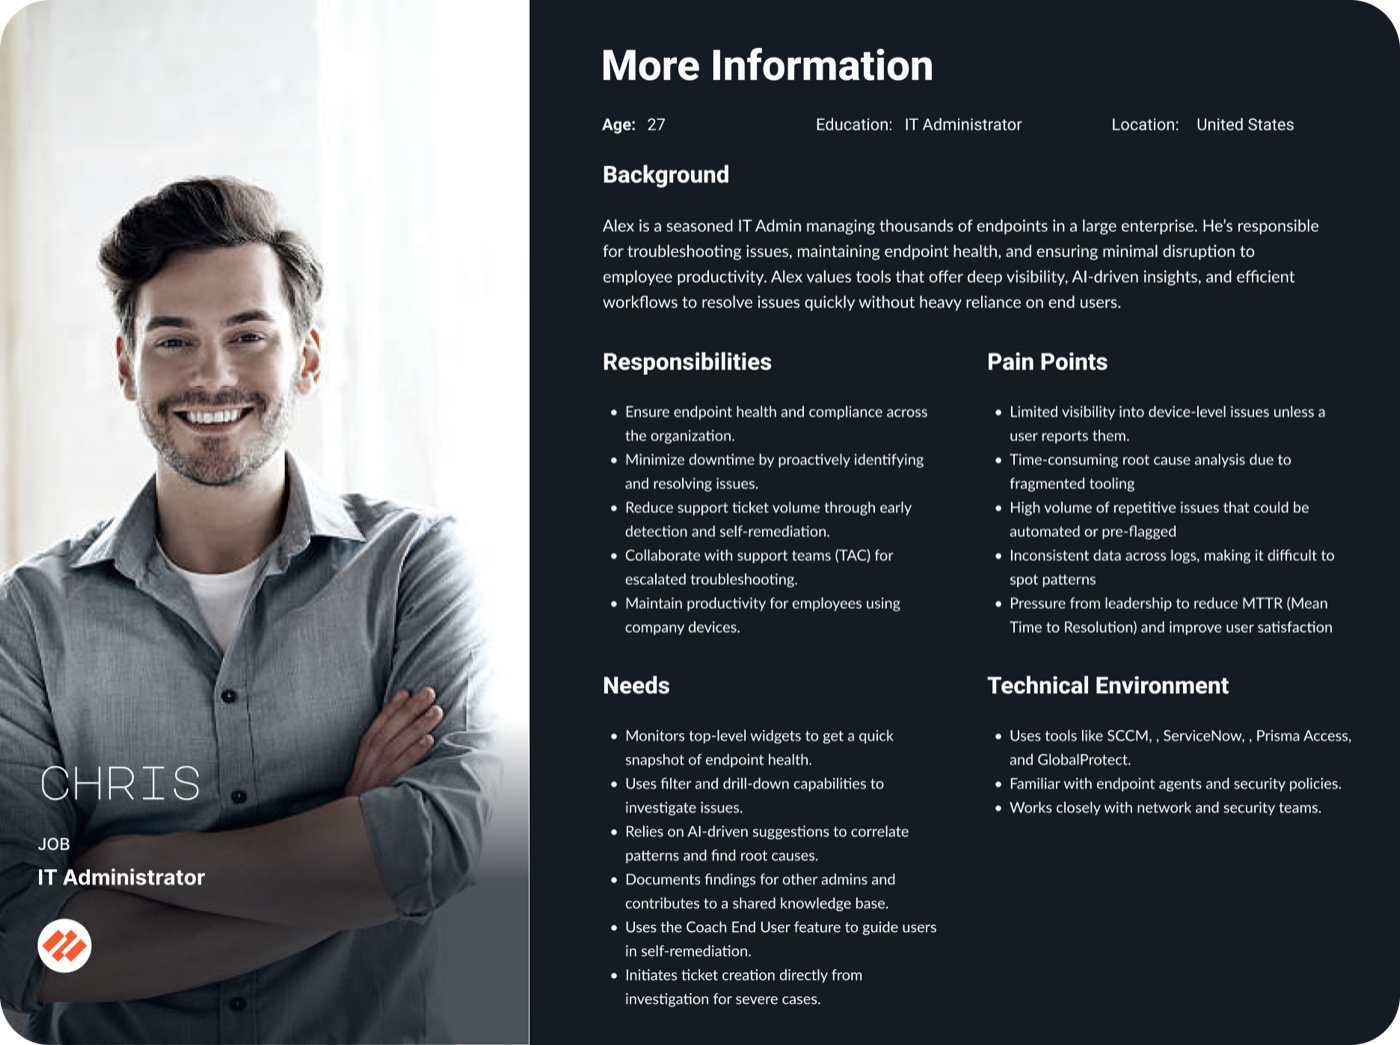
Meet Chris, IT Administrator.
Responsible for endpoint health across a large fleet, Chris needs to spot issues early, find root causes fast, and coach end users without drowning in dashboards.
Six principles that shaped it.
Through collaborative brainstorming and design exploration, we aligned on the core principles behind the solution.
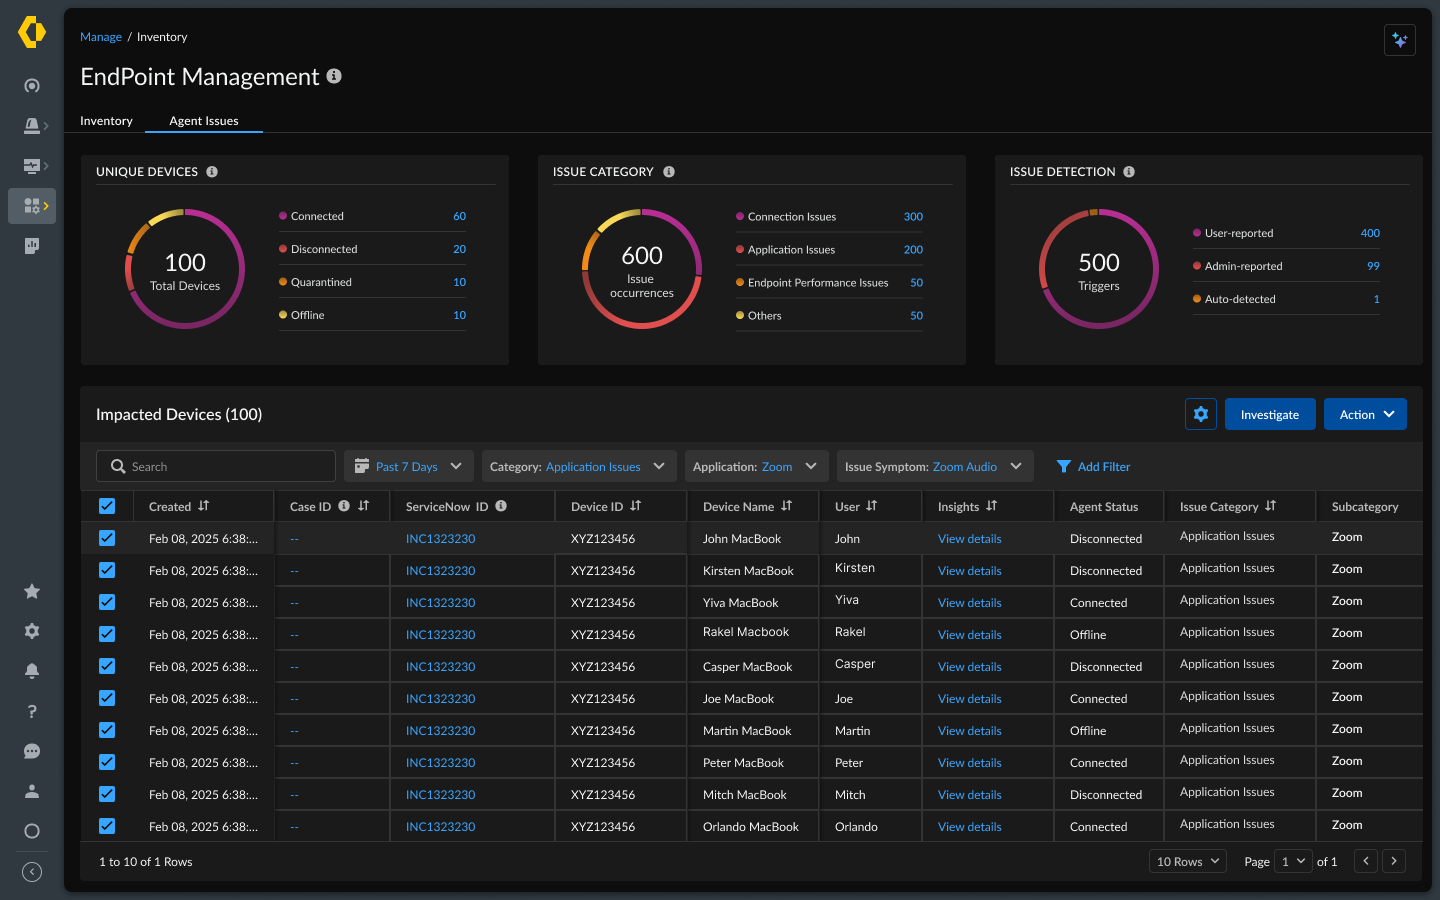
From “something’s wrong” to “here’s why”.
Step through how an admin moves from overview to root cause to comparison.
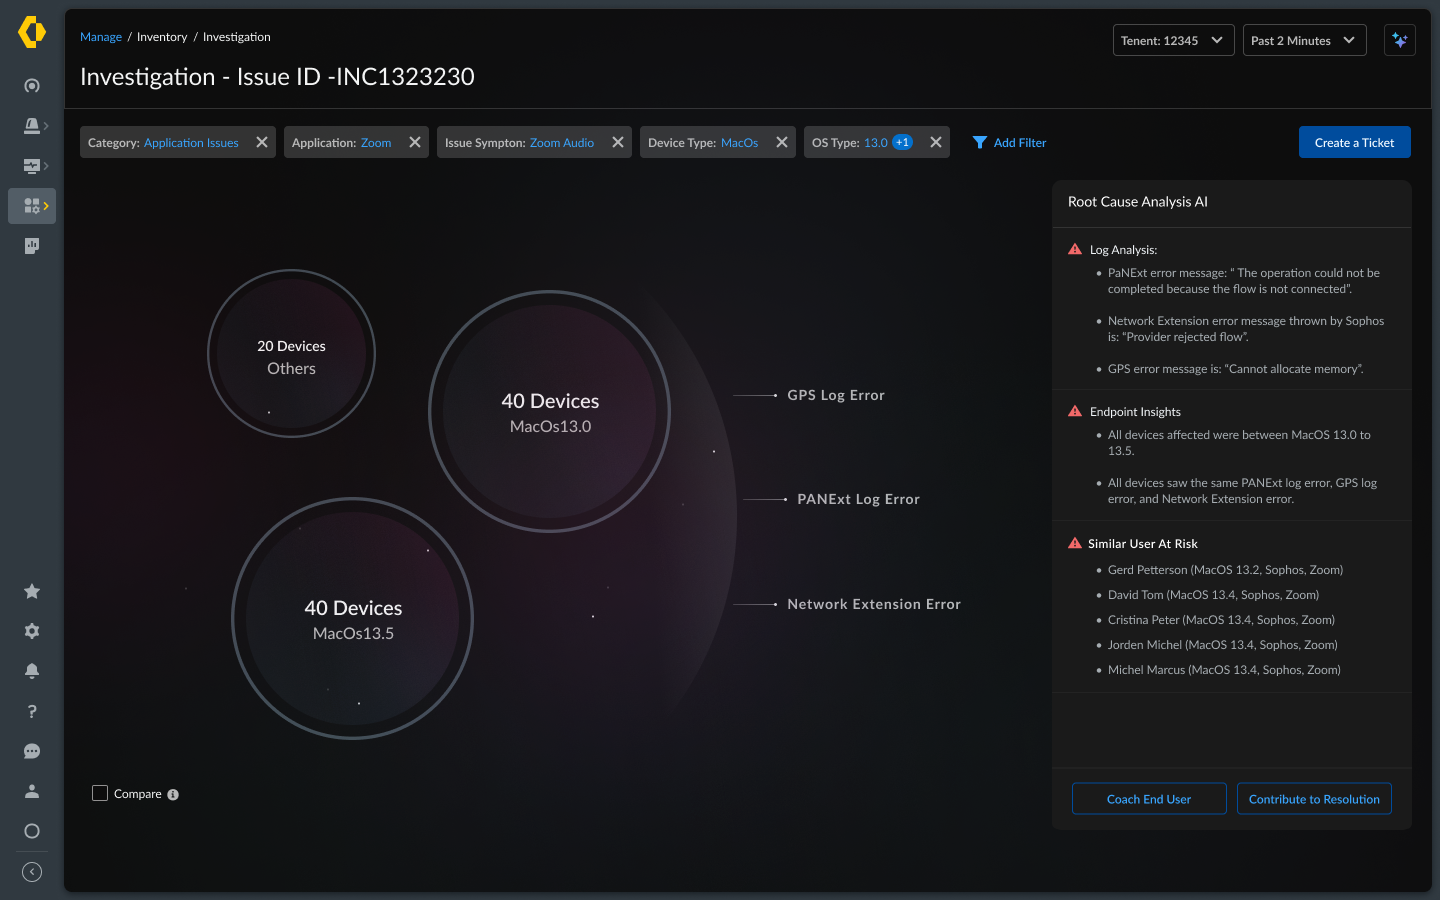
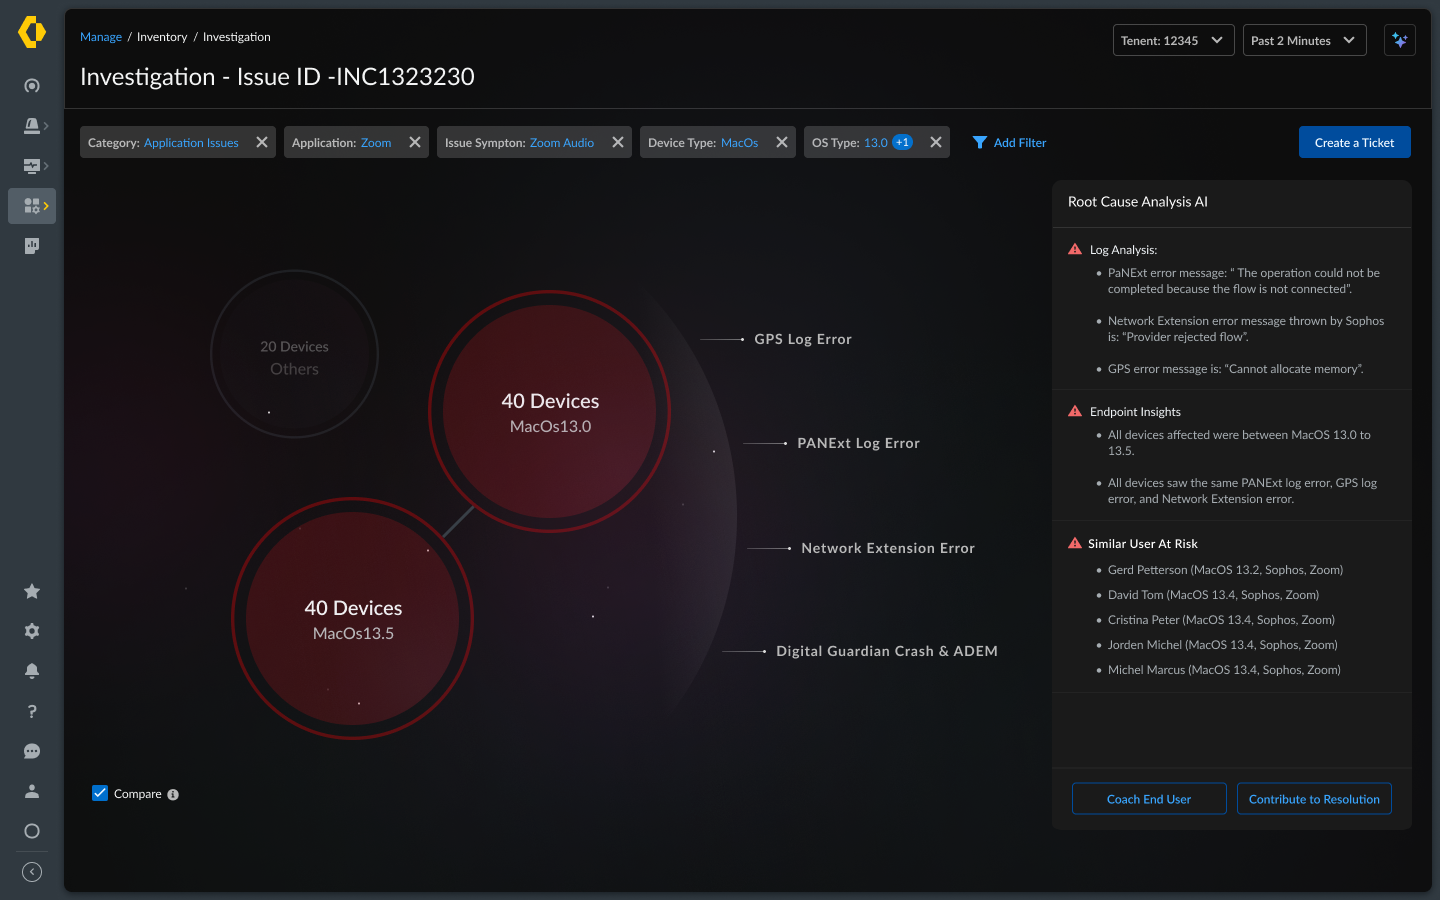
Tested with the people who’d use it.
Once the end-to-end experience was complete, we ran usability testing with enterprise customers and internal Sales Engineers to evaluate the usability, effectiveness and value of Endpoint Insights during real investigations.
- 01Investigate the root cause of endpoint issues
- 02Compare healthy and impacted devices
- 03Interpret diagnostic insights and visual indicators
- 04Coach end users through resolution
- 05Create support tickets with investigation details
What worked
- Visual diagnostics
- Side-by-side comparison views
- The contextual investigation workflow
What to improve
- Clearer guidance in complex workflows
- More context to support decisions
- Simpler interfaces, less cognitive load
- Tooltips and inline explanations
These insights directly informed the next iteration, refining the workflow so admins diagnose and resolve issues more efficiently.
Not a dashboard. A workspace.
By bringing together contextual insights, visual diagnostics and guided workflows, the solution reduces investigation time and minimizes unnecessary escalations.
Endpoint Insights evolved from a passive monitoring dashboard into an intelligent investigation workspace, helping support teams move from identifying problems to resolving them faster and with more confidence.
Explore Endpoint Insight yourself.
Walk through the investigation workflow in Figma.
Open in FigmaFaster detection. Fewer steps.
Beyond monitoring, the Endpoint Insights Engine delivered value across users, support teams and the business.
Issues are spotted sooner.
More issues solved on the first attempt.
Less clicking between tools and screens.
Satisfaction score after the redesign.